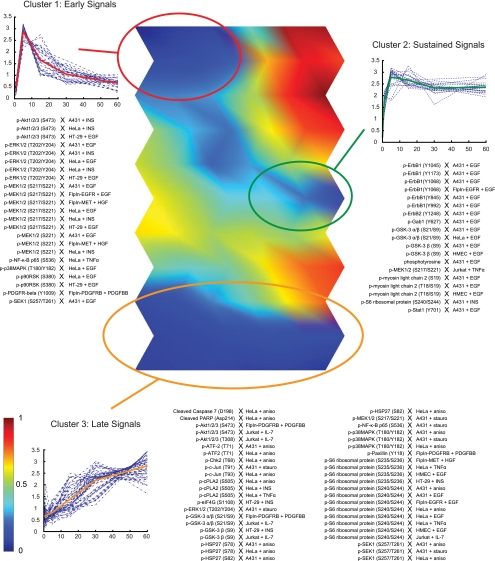
Fig. 5.
Self-organizing map analysis reveals three primary classes of time courses. Shown in the center is a visual representation of the average distances between neighboring map units in a self-organizing map of the time course profiles (U-matrix). Dark blue regions represent clusters of similar dynamic profiles, and regions of early, sustained, and late signaling dynamics (clusters 1, 2, and 3) are highlighted. Early and sustained signals are connected by a transition region of moderately clustered time courses (blue). Shown in panels on the sides are the identities, temporal profiles (dashed lines) and average temporal profiles (solid line) of time courses within each cluster.

