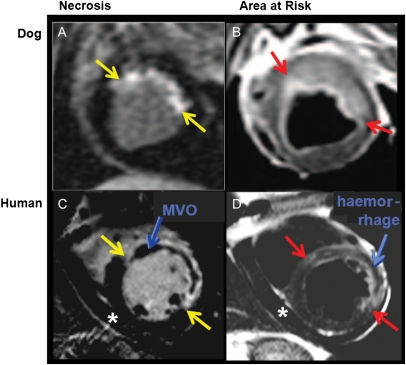
Figure 6.
Tissue characterization by cardiovascular magnetic resonance. On the left-hand side (A and C), late gadolinium enhancement is applied to delineate tissue necrosis as bright areas (red arrows). In the canine experiment, a small subendocardial necrosis is detected, whereas in the patient with acute myocardial infarction (C), a dark core in the centre of necrosis is indicating the presence of microvascular obstruction. On the right, T2-weighted images show increased signal in the myocardium, indicating the presence of oedema, which corresponds to the area at risk. In the patient (D), dark areas in the centre of oedematous tissue indicate haemorrhage. The oedematous tissue [bright on T2-weighted images in (B) and (D)], i.e. the area at risk minus the necrotic tissue [in (A) and (C), respectively] yields the amount of salvaged myocardium.

