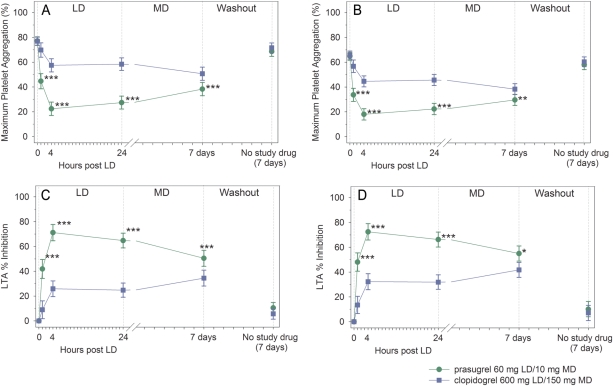
Figure 3.
Platelet aggregation by light transmission aggregometry. (A) Maximum platelet aggregation to 20 μM ADP; (B) maximum platelet aggregation to 5 μM ADP; (C) inhibition of platelet aggregation in response to 20 μM ADP; (D) inhibition of platelet aggregation in response to 5 μM ADP. Values are expressed as the least-squares mean and 95% confidence intervals. Prasugrel and clopidogrel values from each treatment period have been combined. Time 0 is the baseline value (combined for each treatment period). *P= 0.0002, **P = 0.0001, ***P < 0.0001.

