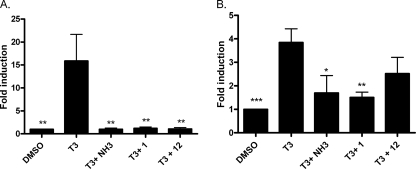
FIGURE 4.
Regulation of T3-controlled genes by treatment with MSNBs in HepG2 cells. The cells were exposed to drugs (100 nm T3 and 10 μm NH-3 or 20 μm MSNB) for 20 h. RT-PCR was carried out to determine transcription levels of the PDK and PEPCK genes. The ΔΔCt method was used to calculate -fold induction of expression. A, PDK4 gene expression induced by the treatment of T3 was reduced by NH-3 and MSNBs. B, PEPCK gene expression was only modestly effected by NH-3 and compound 1. Error bars represent S.E. of two independent experiments performed in triplicate. *, p < 0.05; **, p < 0.01; ***, p < 0.005.

