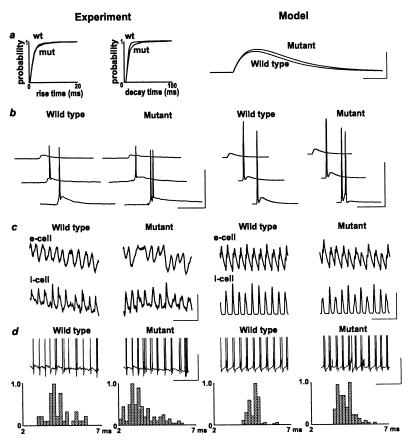
Figure 3.
Firing properties of interneurons are altered by genetically manipulated overexpression of GluR-B. (a) Spontaneous EPSP rise time and decay time plots for stratum pyramidale fast-spiking interneurons, recorded from a membrane potential of −70 mV. Data are shown as cumulative probability for >4,000 EPSPs from five cells from five wild-type and five cells from five mutant mice. Model data show change in unitary EPSC for parameters that best fit the experimental data: “wild-type” unitary EPSC = t exp (−t/0.95) nS, “mutant” unitary EPSC = t exp(−t/1.05) nS. (Scale bars: 0.8 nS, 1 ms.) (b) Firing pattern in response to a single proximal stratum radiatum stimulation. Traces show response (from −70 mV) to increasing stimulus intensity (5–20 V) for interneurons from wild-type and mutant. Note increasing intensities generate double spikes in the cell from the mutant. (Scale bars: 50 mV, 40 ms.) Model data show voltage responses for single interneurons (holding current −0.165 nA) receiving identical EPSC onto single compartments on each of three dendrites. Each EPSC had the time course ct exp(−t/τ), where τ = 0.95 for control and 1.05 for mutant; c = 16.1, 47.4, 83.8 nS (top to bottom). Note the spike doublet in the mutant, but not in the wild type (as in experiment). (Scale bars: 50 mV, 30 ms.) (c) Pattern of pyramidal cell phasic inhibitory input (upper traces) and interneuron phasic excitatory input (lower traces) during posttetanic oscillations, in wild-type and in mutant mice. The interneuron was hyperpolarized by injection of −0.2 nA current. [Scale bars (experiment): 2 mV, 100 ms.] Model data show GABAA conductance to an e-cell (upper traces) and AMPA conductance to an i-cell. Note, in the “mutant,” the more variable amplitude of GABAA inputs, and the variable width of the AMPA inputs. [Scale bars (model): 150 nS, 100 ms.] (d) Example traces of interneuron firing patterns during gamma-frequency oscillations following paired tetanic stimulation, illustrating the increased incidence of doublet formation and the occurrence of occasional spike bursts. Model data show voltage of a selected interneuron from network simulations in the wild type and the mutant. The only difference in parameters for these simulations was in interneuron EPSC time course illustrated in a. [Scale bars (experiment and model): 20 mV, 100 ms.] Below are histograms illustrating the probability of a doublet of interval x relative to the sample mode. There are 45 doublets from wild-type data (n = three cells from three animals) and 130 doublets from mutant data (n = five cells from five animals). Model histograms were constructed by using ≈110 doublet intervals for simulations of “wild type” and “mutant” gamma oscillations, each pooled from seven interneurons.

