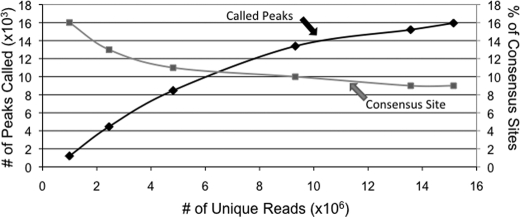
FIGURE 3.
Percentage of consensus sites does not change with increasing reads. Different numbers of uniquely mapped reads were isolated randomly from the total number of uniquely mapped reads in the HA ER E2F1 merged WT ChIP-seq data sets. The number of significant peaks in each set of these randomly selected mapped reads is shown by the line labeled “called peaks”; the corresponding scale for this plot is shown on the left y axis. The number of consensus sites within each set of called peaks is plotted as a percentage of all the peaks in that set (and labeled as “consensus site”); the corresponding scale for the “consensus site” plot is shown on the right y axis.

