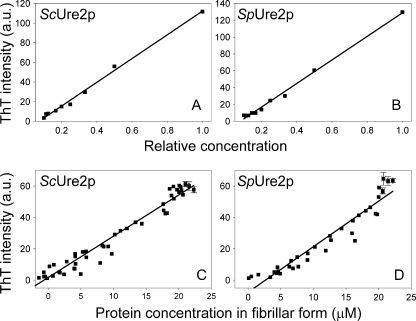
FIGURE 2.
Linear relationship between ThT intensity and protein concentration in fibrillar form. A and B, different concentrations of seeds were produced by serial dilution of (A) ScUre2p fibrils and (B) SpUre2p fibrils, and the ThT intensity was plotted against the relative seed concentration. C and D, relationship of ThT intensity and concentration of Ure2p in the pellet fraction at different stages throughout the process of fibril formation for (C) ScUre2p and (D) SpUre2p. The data from 5 growth curves were included for each protein. The points within the plateau region (where the error in determining the protein concentration is largest) were averaged for each individual growth curve, and the error bars represent the standard error of the mean (n = 3 to 6).

