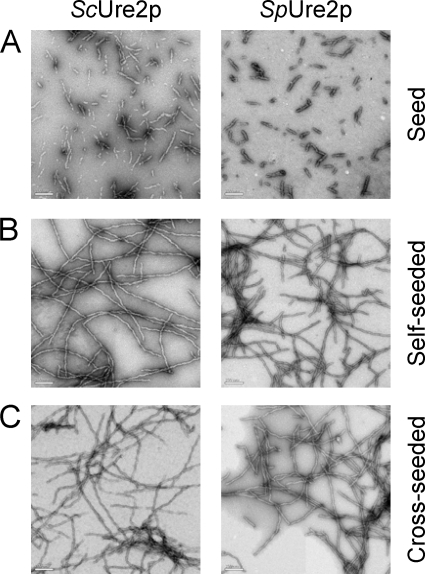
FIGURE 4.
Electron microscopy images of Sc seeds and Sp seeds, and the fibrils produced in the cross-seeding experiments. The images show (A) freshly prepared seeds, (B) self-seeded fibrils, and (C) cross-seeded fibrils grown in a solution of 20 μm ScUre2p (left column) or SpUre2p (right column) in 50 mm Tris-HCl, pH 8.4, 200 mm NaCl, as described in the “Experimental Procedures.” The bars represent 200 nm.

