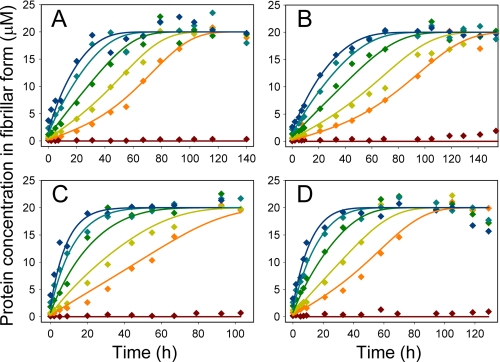
FIGURE 5.
Time courses of fibril formation in cross-seeding experiments monitored by ThT fluorescence. Solutions (20 μm) of ScUre2p (A and B) or SpUre2p (C and D) were incubated with a series of concentrations of Sc seeds (A and C) or Sp seeds (B and D): 0% seed (brown), 1% seed (orange), 2% seed (ochre), 4% seed (green), 7% seed (teal), 10% seed (blue), in 50 mm Tris-HCl, pH 8.4, 200 mm NaCl. The data were fitted globally to obtain the ratios of the rate constants for elongation and breakage, as described under “Experimental Procedures.”

