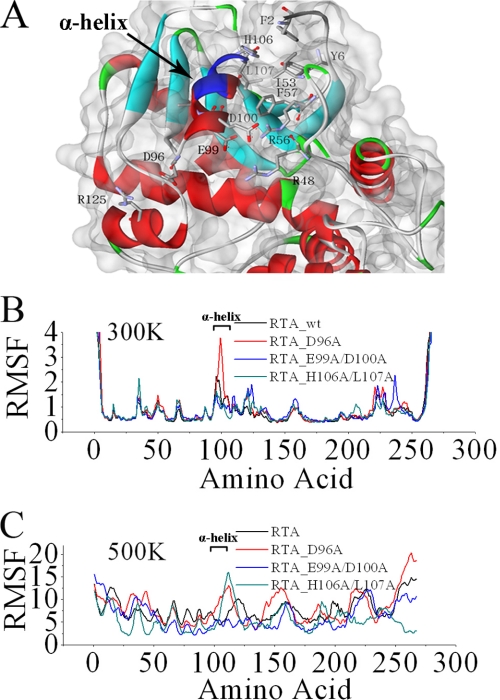
FIGURE 4.
Rational design of RTA variants. A, stereo diagram showing the overall fold of the RTA. The epitope of mAb 6C2 is colored in blue. B and C, the average fluctuation per residue calculated over the last 40 ns of the trajectory. Root mean square fluctuation values were calculated relative to the starting structure at 300 K (B) and 500 K (C).

