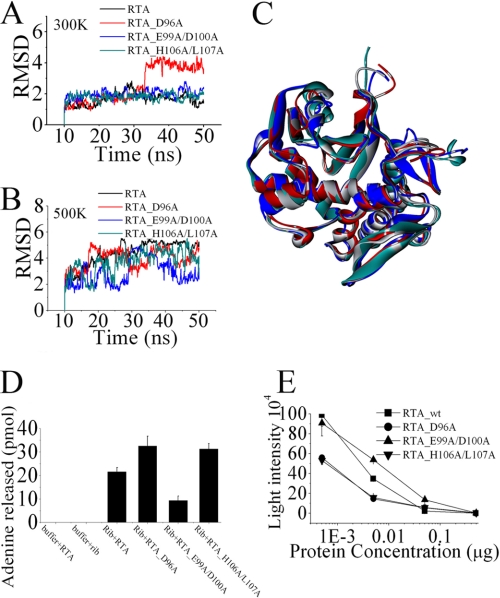
FIGURE 5.
Characterization and comparison of RTA variants. A and B, RMS deviations for the α-helix (residues 99–106 of RTA). Molecular dynamic simulation of RTA variants were performed at 300 K (A) and 500 K (B). The last 40 ns of each trajectory were used for analysis. C, the average structures of each RTA variant over the last 10 ns of simulation at 300 K are superimposed and shown. RTA is colored in gray, RTA_D96A in red, RTA_E99A/D100A in blue, and RTA_H106A/L107A in green. D, quantity of adenine released from 80 S rabbit reticulocyte ribosomes. The extent of ribosome depurination was quantified by using HPLC. E, the extent of protein synthesis inhibition by RTA variants was evaluated in cell-free assays. The different concentrations of RTA variants were incubated with a cell-free in vitro translation mixture. Luciferase activity reported in relative light intensity is representative of protein translation and measured after 90 min at 30 °C. Data are mean ± S.D. of at least three experiments.

