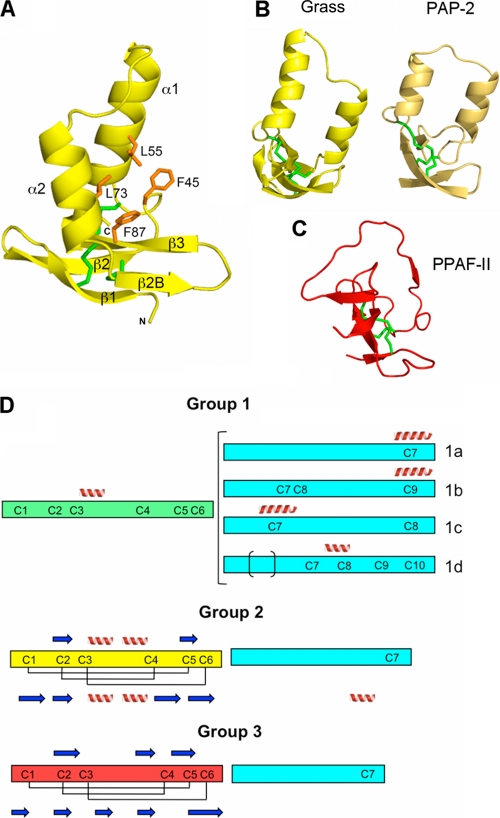
FIGURE 4.
Clip domain of Grass and the classification of the clips into three groups. A, structure of the clip domain in ribbon representation. The orientation is slightly different from in Fig. 2A, for more clarity on the β-strands. The hydrophobic residues are represented as orange sticks. The cysteines are colored in green, and the α-helices and the β-strands are annotated. B, overall structure of clip domains of Grass (in yellow) and Ms-PAP2 (in light brown). A rotation of approximately 90° was applied along the vertical axis, compared with A. C, overall structure of PPAF-II clip domain of group 3, in the same orientation as in B. D, schematic organization of the three groups of clip domains. The clip domain and the linker sequences are represented as rectangles of different colors: cyan for the linkers, green for clip domain of group 1, yellow for clip domain of group 2, and red for group 3. α-Helices and β-strands predicted by the Jpred program are represented as spirals and arrows above the rectangle, and the experimentally determined disulfide bridges and secondary structures are represented below the rectangle.

