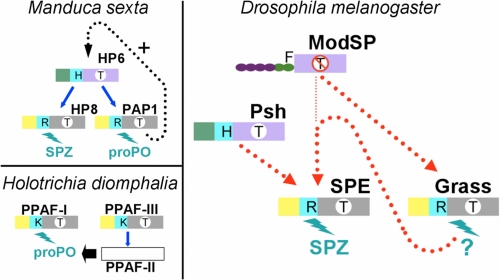
FIGURE 5.
Schematic organization of the proteolytic cascades involving clip proteases. Upper left, proPO activation in M. sexta (16). Lower left, proPO activation in H. diomphalia (39). Right, model for Toll activation in Drosophila. The penultimate and terminal clip-SPs are colored according to their belonging to the groups defined in Fig. 4D. The clips are colored in green for group 1 or in yellow for group 2. The linker is in cyan. The catalytic domains are colored in purple or in gray, depending on the absence or the presence of the 75-loop. The letter in a white circle on the catalytic domain indicates the substrate specificity: T indicates trypsin-like; T with a line through it indicates different specificity. The letter in the linker stands for the P1 residue of the activation site. The N-terminal domains of ModSP are represented as a chain of beads. The letter on the top (F) is the P1 residue of the activation site. Blue arrows indicate an experimentally described direct interaction. A dashed black arrow indicates a hypothetical positive feedback mechanism (16). A dashed red line indicates a link demonstrated by epistasic studies (in D. melanogaster).

