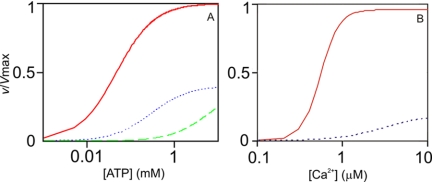
FIGURE 5.
Simulation of K and V type regulation of αCaMKII. A, Equation 1 was used with Km4 and Vmax values for wild type CaM (solid line) and CaM3 (dotted and dashed line) mutant (Table 1), with [ATP] at 1 mm. The previously determined value of 80 nm was used for Kd3, the dissociation constant for Ca2+n·CaM binding to αCaMKII·ATP (22). The dotted line represents data at 6 μm CaM3, and the dashed line represents data at 0.1 μm CaM3. K type switch is indicated by the substantial left shift of the activation curve by increasing the Ca2+·CaM concentration and by occupancy of EF-hand 3 in the CaM C lobe. B, Equation 2 was used with parameters Vmax, Kact1, n, and Km4 values for wild type CaM (solid line) and CaM1 mutant (dotted line), as shown in Table 1, with [ATP] at 1 mm. The V type activity switch is demonstrated by the large jump in activity by occupancy of the N lobe EF-hand 1. Equation 1, v = kcat [αCaMKII]o/(1 + Km4/[ATP] +Kd3/[Ca2+n·CaM] + Kd3Km4/[ATP][Ca2+n·CaM]), where n is the measured Hill coefficient. Equation 2, v = kcat [αCaMKII]o/(1 + Km4/[ATP] + Kact1n/[Ca2+]n + Kact1nKm4/[Ca2+]n[ATP]), where n is the measured Hill coefficient.

