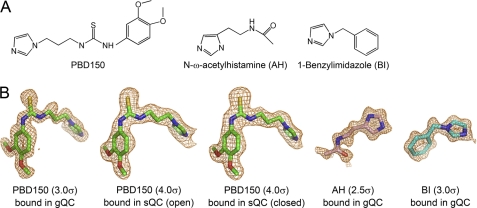
FIGURE 5.
The QC inhibitors used in the present study. A, chemical structure of the QC inhibitors. B, the Fo − Fc stimulated annealing omit densities for the inhibitors bound in various QC structures, as indicated, are overlaid with the final refined models. The contour levels of the densities are also indicated.

