FIGURE 4.
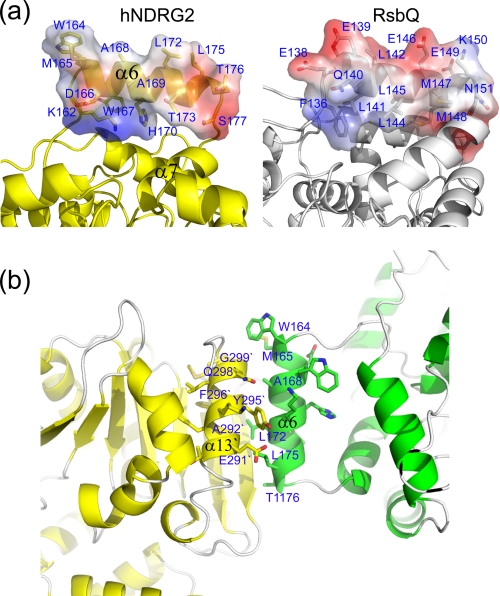
Structural analysis of the cap-like domain of NDRG2. a, comparison of the residue distribution of helix α6 of NDRG2 with the corresponding helix in RsbQ. The surface is represented in a range of colors that indicate electrostatic potential, with red being negative and blue being positive. b, analysis of interaction interface of the symmetry-related K2Y molecules.

