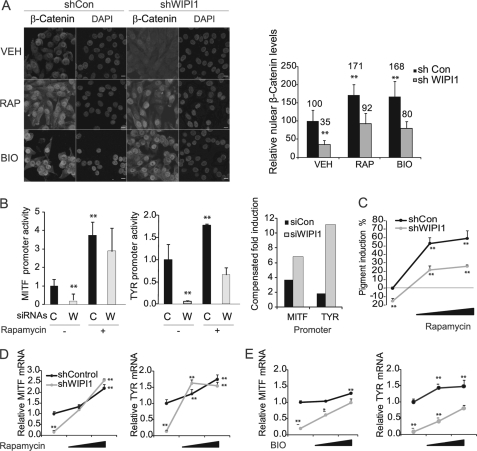
FIGURE 4.
WIPI1 regulates MITF transcription by suppressing TORC1 and GSK3β. A, MNT-1 cells expressing control or WIPI1 shRNA were treated with vehicle, 5 μm BIO, or 10 nm rapamycin (RAP) for 24 h. Cells were stained with β-Catenin antibody and examined by confocal microscopy. Right, relative nuclear β-Catenin levels were quantified using ImageJ. Data shown are mean ± S.D. (n = 100). Scale bar, 10 μm. B, MNT-1 cells transfected with WIPI1 (W) or control (C) siRNA were incubated in the presence and absence of rapamycin for 48 h. Cells were subsequently transfected with MITF-M and TYR promoter constructs, and relative luciferase activity was determined. Data shown are mean ± S.D. (n = 5). Compensated -fold induction is the ratio of treated to untreated samples for each individual siRNA transfection. C, MNT-1 cells expressing control or WIPI1 shRNA were treated with 0, 1, or 10 nm rapamycin for 5 days. Relative melanin accumulation was measured spectrophotometrically as described. Data shown are mean ± S.D. (n = 5). MNT-1 cells were treated with 0, 0.1, or 0.5 nm rapamycin for 5 days (D) or 0, 1,or 5 μm BIO for 24 h (E), and the relative accumulation of MITF-M and TYR mRNA levels was measured by RT-qPCR. Data shown are mean ± S.D. (n = 3). For all subfigures, *, p < 0.05 or **, p < 0.01 using a Student's t test versus control (Con) RNAi treated with vehicle (VEH). Each experiment was performed three times in triplicate.

