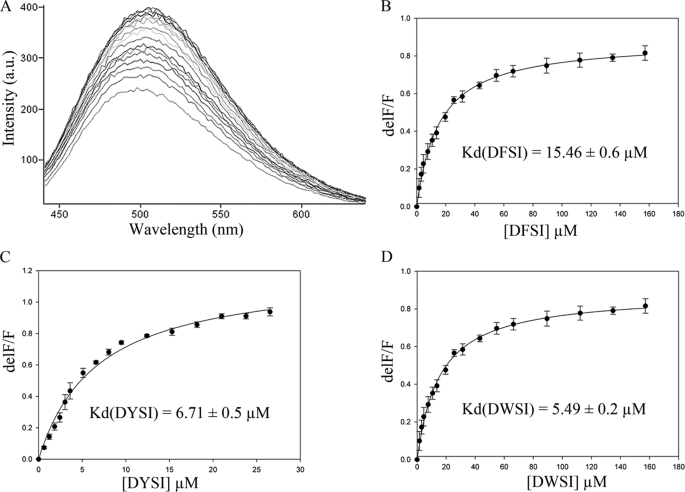
FIGURE 3.
Changes in fluorescence spectrum of EhOASS to study the binding affinity of peptides. A, shown is a typical fluorescence spectrum of EhOASS with titration of peptide. The fluorescence emission of PLP in the active site was monitored by changes in fluorescence at 508 nm versus DFSI concentration (B), DYSI concentration (C), and DWSI concentration (D). a.u., arbitrary units.

