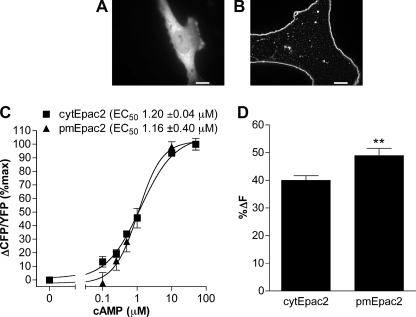
FIGURE 1.
Characterization of Epac2 cAMP sensors. A and B, WT MEFs were transduced with adenoviral constructs encoding either cytEpac2 (A) or pmEpac2 (B). Scale bar, 10 μm. C, in vitro dose-response curves of Epac2 sensors expressed in HEK293 cells. Changes in FRET (ΔCFP/YFP) responses to cAMP were measured using a SpectraMax fluorometer. Data represent the mean ± S.E., and normalized data were analyzed using sigmoidal dose response (variable slope) (n ≥ 9). D, WT MEFs transduced with cytEpac2 or pmEpac2 were incubated with IBMX (100 μm) and forskolin (50 μm), and the maximum decrease in FRET was calculated. Data represent mean ± S.E. from four or more experiments. Error bars, S.E.; **, p < 0.01.

