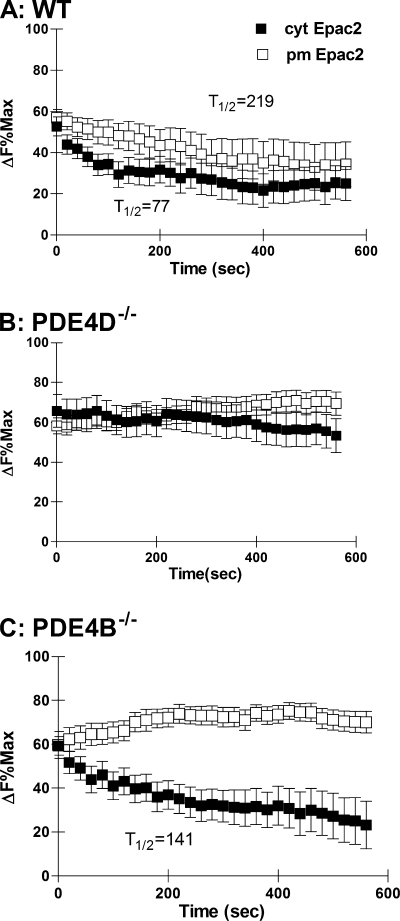
FIGURE 3.
Decay of cAMP response following Iso stimulation. A, B, and C, WT (A) and MEFs deficient in PDE4D (B) or PDE4B (C) expressing either cytEpac2 (■) or pmEpac2 (□) were incubated with 10 nm Iso. Data are expressed as a percentage of the maximum response for cytEpac2 and pmEpac2 in cells treated with IBMX and forskolin (see Fig. 1C). Where possible, the half-time (t½) to return to a new steady state level of cAMP concentration was calculated using exponential decay analysis from the maximal Iso response. Error bars, S.E.

