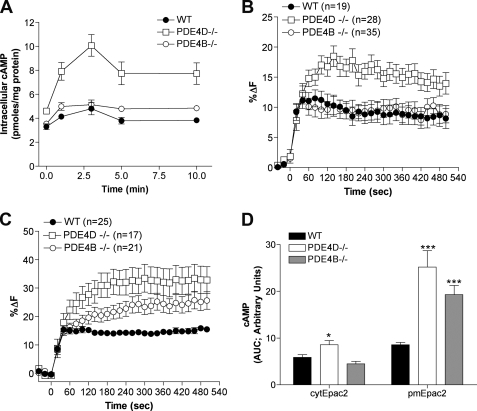
FIGURE 4.
cAMP levels in PDE4B- and PDE4D-null MEFs stimulated with 100 nm PGE2. A, cells were incubated for the indicated times with 100 nm PGE2, and cAMP concentration in the cell extracts was measured by RIA. The graph reports the mean ± S.E. of three separate experiments. B and C, MEFs transduced with cytEpac2 (B) or pmEpac2 (C) were incubated for the indicated times with 100 nm PGE2, and the percent change in FRET (%ΔF) was calculated. In each case, the cell number (n) is given. D, the cAMP response to 100 nm PGE2 treatment for MEFs expressing either cytEpac2 or pmEpac2 expressed as the area under the curve (AUC). Data were analyzed using the unpaired t test; ***, p < 0.0001 (WT versus PDE4B−/− and PDE4D−/−; pmEpac2); *, p = 0.0113 (WT versus PDE4D−/−; cytEpac2) and p = 0.604 (WT versus PDE4B−/−; cytEpac2). Data represent mean ± S.E. Error bars, S.E.

