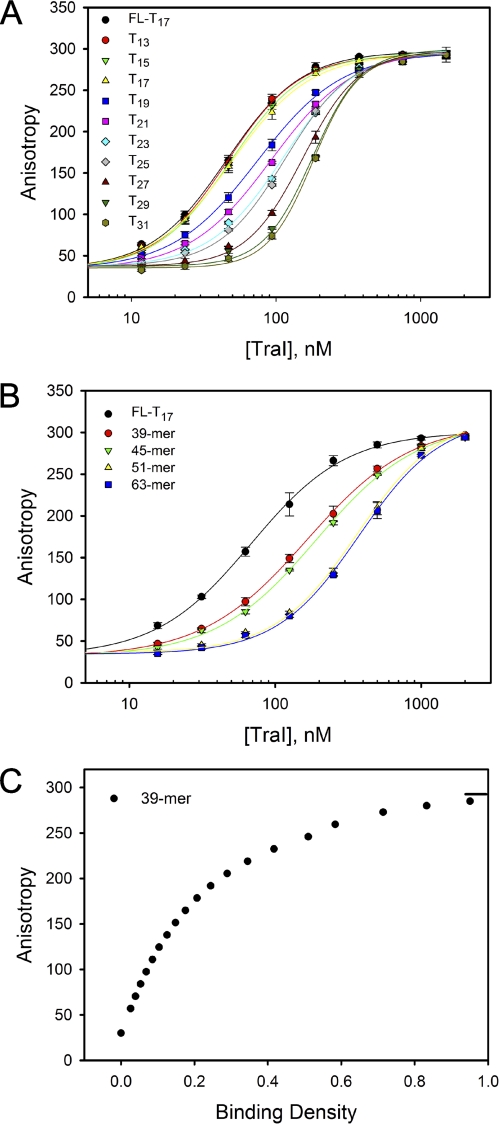
FIGURE 2.
Determination of the stoichiometry of ssDNA binding by TraI. Titration of 50 nm FL-T17 with TraI was performed in the presence or absence of 200 nm Tn (n ranges from 13 to 31) (A) and 350 nm 39-, 45-, 51-, and 63-mer ssDNA (B) in standard DNA binding buffer at 25 °C. The solid lines are used to separate the data and do not have any theoretical basis. C, dependence of observed anisotropy on the total averaged binding density of TraI on the 39-mer. This plot was constructed based on the titration curve in B using the MCT analysis (27). The short solid line indicates the maximum value of the observed anisotropy. The stoichiometry was estimated to one TraI molecule per 39-mer from this plot.

