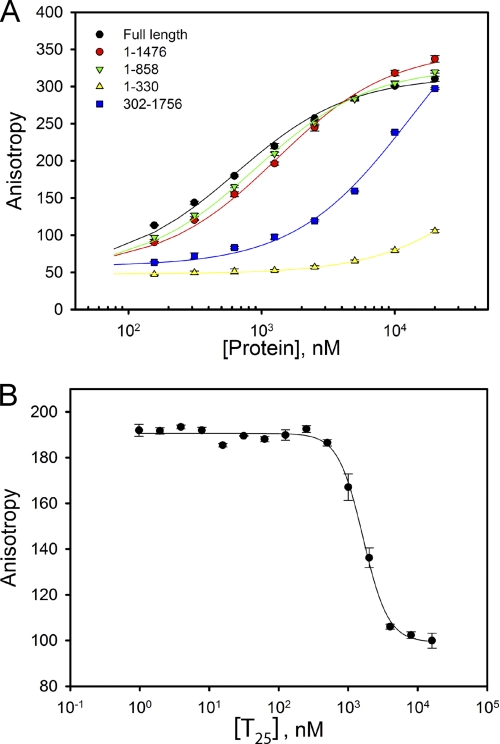
FIGURE 5.
Identification of the location of the dsDNA-binding site. A, titration of 50 nm FL-dsDNA15 with different TraI deletion mutants was performed using the direct DNA binding assay in standard DNA binding buffer at 25 °C. The solid lines are computer fits of the binding curves using a one-site binding model (Equation 2). The macroscopic binding constants, KN, derived from the computer fits are summarized in Table 4. B, competition of dsDNA and ssDNA for the binding of TraI. Titration of a mixture of 100 nm FL-dsDNA15 and 100 nm TraI with increasing concentration of 25-mer ssDNA, T25, was performed in buffer A at 25 °C. The solid line is the computer fit of the curve using nonlinear least square regression.

