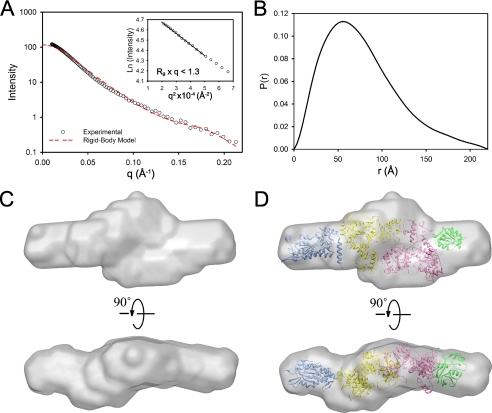
FIGURE 8.
Solution structure of TraI. A, SAXS profiles of TraI. The theoretical scattering profile of the rigid -body model for TraI (D) is shown by the red dashed line. The inset is the Guinier plot of the experimental scattering profile. The solid lines are least square linear fits of the data under the condition Rg × q <1.3. B, P(r) plot of TraI. The maximum dimension (Dmax) is derived to be 220 Å. C, DAMMIN model of the TraI shown in volumetric representation. D, DAMMIN model of TraI superimposed with the atomic structures of the four structural domains of TraI (blue, the crystal structure of the relaxase domain residues 1–307, PDB entry 1P4D; yellow, the homology model of the RecD-like domain I, residues 310–844, from this work; pink, a homology model of the RecD-like domain II, residues 845–1476, from this work; green, the crystal structure of TraI 1476–1628, PDB entry 3FLD).

