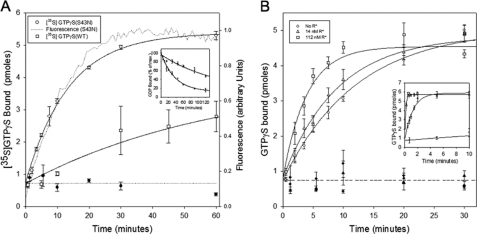
FIGURE 3.
The R*-independent and R*-dependent GDP-GTP exchange activity of αT* (S43N). A, 50 μm GTPγS or [35S]GTPγS was added to 300 nm αT*(S43N) or wild-type αT*. In the case of GTPγS (dotted: αT*(S43N)), the tryptophan fluorescence emission was monitored in real-time with the excitation wavelength set at 300 nm and the emission wavelength at 345 nm. When assaying [35S]GTPγS binding to either αT*(S43N) (○) or wild-type αT* (□), aliquots (20 μl) of the reaction mixture were removed at the indicated times and added directly to pre-wetted nitrocellulose filters on a suction manifold to quench the reaction. The filters were subsequently washed twice with HM buffer and added to 3 ml of scintillation fluid and counted on a scintillation counter. The y-axis shows the number of pmol of GTPγS in 20 μl of the filtered reaction mix. The radioactivity data is shown as mean ± S.E. of three independent experiments. A combined single exponential fit (solid line) of all 3 data sets for αT*(S43N) yielded a rate constant of 0.076 ± 0.005 min−1 (± S.E.). A single exponential fit of the fluorescence data for αT*(S43N) yielded a rate constant of 0.085 ± 0.003 min−1 (mean ± S.E.; n = 21). Data from experiments carried out in the absence of αT*(S43N) or wild-type αT* are shown as closed circles. Inset, αT*(S43N) or wild-type αT* (5 μm) was incubated in the presence of 100 μm [3H]GDP for either 2 or 3 h, respectively. The mixtures were diluted 10-fold into HM buffer containing 1 mm GTPγS and incubated at room temperature. At different times, aliquots (20 μl) of the reaction mixture were removed and treated as described above. The y-axis shows the percentage of [3H]GDP remaining bound to the αT* subunits, relative to the amount bound after 15 s of incubation. Wild-type αT*: □. αT*(S43N) : ○. B, 50 μm [35S]GTPγS was added to 300 nm αT*(S43N) in the presence of 400 nm β1γ1 and the indicated concentrations of R* (○: no R*; △: 14 nm R*; □: 112 nm R*). The samples were filtered and counted as described in panel A. The y-axis shows the number of pmol of GTPγS in 20 μl of the reaction mix. The radioactivity data are shown as mean ± S.E. of 3 independent experiments. Data from experiments carried out in the absence of αT*(S43N) are shown as corresponding closed symbols. Inset, 50 μm [35S]GTPγS was added to 300 nm wild-type αT* in the presence of 400 nm β1γ1 and the indicated concentrations of R* (○: no R*; △: 14 nm R*; □: 112 nm R*). The samples were filtered and counted as described in panel A.

