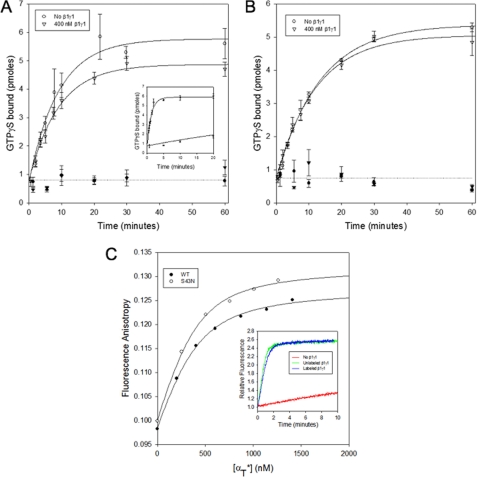
FIGURE 4.
Effects of β1γ1 on the GDP-GTP exchange activity of αT* (S43N). A, 50 μm [35S]GTPγS was added to 300 nm αT*(S43N) and 14 nm R* in the absence (○) or presence of 400 nm β1γ1 (▿). The samples were filtered and counted as described in the legend for Fig. 3A. The radioactivity data is shown as the mean ± S.E. of three independent experiments. The lines through the data show a simultaneous single exponential fit of all 3 data sets. Data from experiments carried out in the absence of αT*(S43N) are shown as corresponding closed symbols. Inset, 50 μm [35S]GTPγS was added to 300 nm wild-type αT* and 14 nm R* in the absence or presence of 400 nm β1γ1. The samples were filtered and counted as described in the legend for Fig. 3A. B, 50 μm [35S]GTPγS was added to 300 nm αT*(S43N) in the absence (○) or presence of 400 nm β1γ1 (▿). The samples were filtered and counted as described in the legend for Fig. 3A. The y-axis shows the number of pmol of GTPγS in 20 μl of the reaction mix. The radioactivity data is shown as the mean ± S.E. of three independent experiments. The lines through the data show a simultaneous single exponential fit of all 3 data sets. Data from experiments carried out in the absence of αT*(S43N) are shown as corresponding closed symbols. C, aliquots of wild-type αT* (○) and αT*(S43N) (●) were added successively to the β1γ1 complex (400 nm) labeled with IAEDANS in HMDM buffer and the fluorescence anisotropy was monitored (excitation = 336 nm, emission = 490 nm). The data were fit to a bimolecular binding model. Inset, 50 μm GTPγS was added to 300 nm wild-type αT* and 10 nm R* in the absence (red line) or the presence of either 60 nm unlabeled β1γ1 complex (green), or the β1γ1 complex labeled with IAEDANS (blue line) in HMDM buffer, and the tryptophan fluorescence emission was monitored in real-time with the excitation wavelength set at 300 nm and the emission wavelength at 345 nm.

