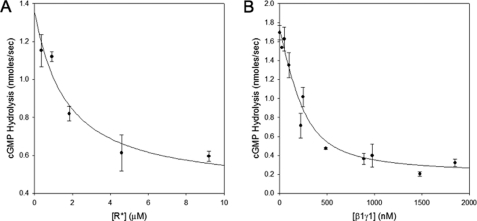
FIGURE 7.
Effects of R* and β1γ1 on PDE activation by αT* (S43N). αT*(S43N) bound to GTPγS was prepared as described in Fig. 6B. This was diluted in AB buffer to a final concentration of 250 nm. Subsequently, the β1γ1 subunit complex (500 nm, panel A) or R* (4.8 μm, panel B) was added to the sample in the presence of varying concentrations of R* (panel A) or β1γ1 (panel B). PDE was added to a final concentration of 160 nm, and its activation was measured as described for Fig. 6B.

