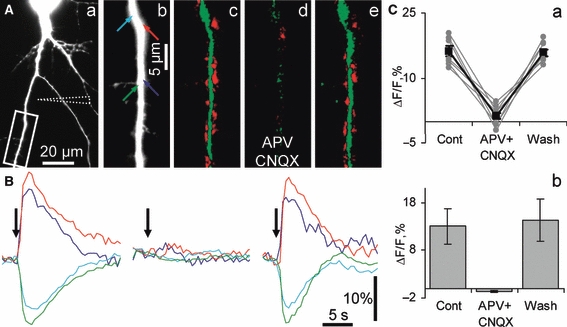
Fig. 1.

Local iontophoretic glutamate application induced hippocalcin-YFP translocation in cultured hippocampal neurons. (A) A set of images demonstrating glutamate-induced changes in hippocalcin-YFP fluorescence in an apical dendrite of an iontophoretically stimulated neuron. The fluorescent image (a) was taken using the YFP filter set. The position of the iontophoretic pipette is indicated by dashed lines. (Ab) A higher magnification image of a dendritic branch shown in the boxed area in Aa. Differential pseudocolour images were taken 2.5 s after the onset of short iontophoretic glutamate stimulation in control (c), in APV and CNQX (d), and after blocker washout (e). In this and other figures a green colour represents a decrease and red represents an increase in hippocalcin-YFP fluorescence. Colour arrows in b indicate sites where regions of interest (ROIs) were placed. Time courses of fluorescence changes in these ROIs in control, APV and CNQX, and after blocker washout are shown in B. Colours of traces match arrow colours in Ab. Onsets of iontophoretic glutamate applications are shown by black arrows. (C) Representative (taken from seven ‘red’ ROIs in the experiment shown in A) (a) and pooled (b) graphs showing a complete suppression of hippocalcin-YFP translocation by ionotropic glutamate receptor blockers.
