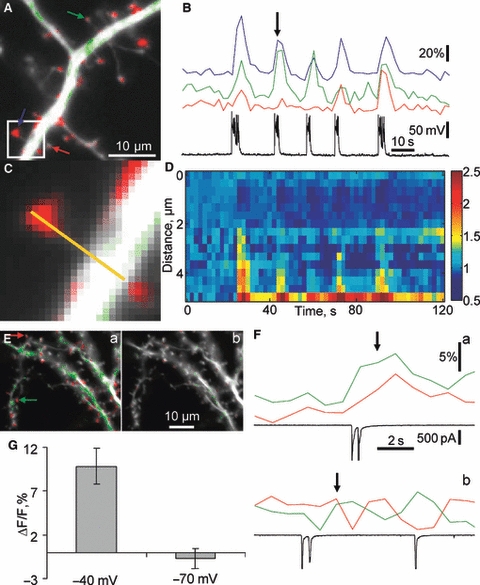
Fig. 6.

Intrinsic bursts of network activity induced hippocalcin-YFP translocation to dendritic spines. (A) An overlay of hippocalcin-YFP fluorescent image and pseudocolour image demonstrating hippocalcin-YFP translocation sites at the moment indicated by a black arrow in B. A green colour represents a decrease and red represents an increase in hippocalcin-YFP fluorescence. Colour arrows in A indicate spines in which changes of fluorescence during bursting activity are demonstrated in B with the same colour coding. Changes in the neuronal membrane potential were simultaneously recorded and shown in B as a black trace. The translocation occurred in a normal extracellular solution (no glutamate receptor blockers and 1 mm Mg2+) with 1 μm of gabazine to decrease inhibition in order to induce bursting network activity. Not all spines showed an increase in hippocalcin-YFP fluorescence in response to a particular spontaneous network burst (compare red and green traces in B). A part of the dendritic tree indicated as a white square in A is shown in C at higher magnification. (D) Time course of hippocalcin-YFP fluorescent changes along a yellow line in C (distance ‘0’ represents a yellow line end opposite to a dendritic head). (E, F) Hippocalcin-YFP translocation to spines was due to direct Ca2+influx via NMDARs rather than due to other mechanisms related to the bursting network activity. Hippocalcin-YFP translocation induced by spontaneous bursting activity was recorded in a neuron voltage clamped at −40 mV (Ea, Fa) and −70 mV (Eb, Fb) in order to relieve and engage Mg2+block of NMDARs, respectively. (E) An overlay of morphological (white) and hippocalcin-YFP translocation images of a neuron taken at the time indicated by black arrows in F. Colour arrows in Ea indicate spines in which fluorescent changes during bursting activity are demonstrated in F with the same colour coding. Changes in the neuronal membrane current were simultaneously recorded and shown in F as black traces. (G) Comparison of hippocalcin-YFP translocation amplitudes in spines at −40 and −70 mV.
