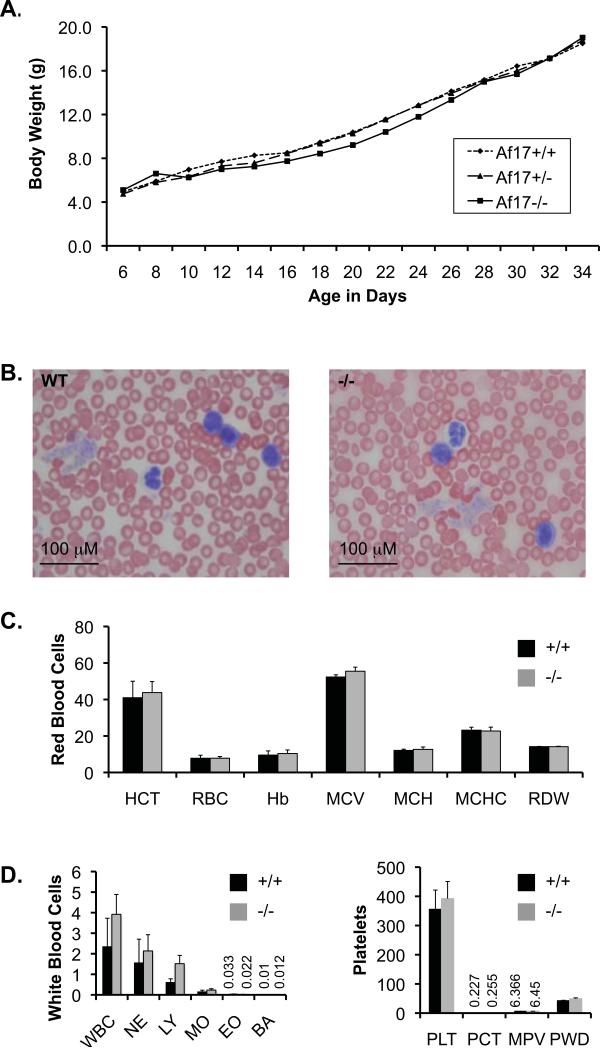
Fig. 2. Af17-/- animals do not display obvious abnormality in growth rate and peripheral blood morphology.
A. Shown is a growth curve plotting body weight (g) vs age in days. Body weights of WT (n=8 mice), Af17+/- (n=14 mice) and Af17-/- (n=10 mice) were recorded every other day as indicated. No significance between any two genotypes at any given time point was observed. For simplicity, SEM is not shown. Each SEM is less than 20% of the means. B. Representative images of peripheral blood smears revealing no abnormal blood cells from WT (n=5 mice) and Af17-/- animals (n=5 mice). Areas where cells did not overlap were randomly picked, at least 10 fields examined and pictures taken. C-E. Complete blood count. Shown are means ± SEM of various blood parameters from 6-8 week old WT (n= 3 mice) and Af17-/- mice (n= 8 mice) as indicated. HCT: hematocrit (%); RBC: red blood cells (106/μL); Hb: hemoglobin (g/dL); MCV: mean corpuscular (erythrocyte) volume (fL); MCH: mean corpuscular hemoglobin (pg); MCHC: mean corpuscular hemoglobin concentration (g/dL); RDW: red cell (erythrocyte volume) distribution width (%); WBC: white blood cell (leukocyte count) (103/μL); NE, LY, MO, EO, and PA: absolute number of neutrophils, lymphocytes, monocytes, eosinophils, and basophils (103/μL), respectively; PLT: platelet (thrombocyte count) (103/μL); PCT: platelet crit. MPV: mean platelet volume (fL); PWD: platelet distribution width.

