
Figure 3.
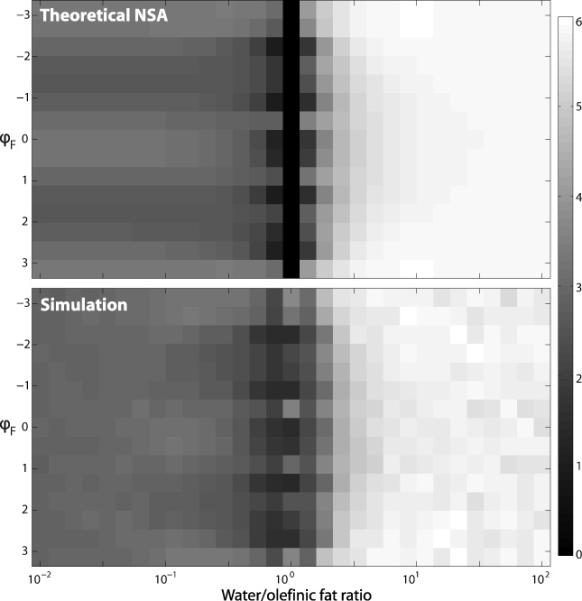
Effective number of signal averages (NSA) for water component estimation from magnitude images, using a 6-point acquisition with TE shifts evenly distributed between 0 and 10 ms. (Top) Theoretical NSA (obtained from Cramér-Rao bounds). (Bottom) Empirical NSA (obtained from MSE observed in simulation with 10,000 trials using SNR=10). Values are shown for different initial phase shifts between the water and olefinic fat components, and for different water/olefinic fat ratios.