
Figure 5.
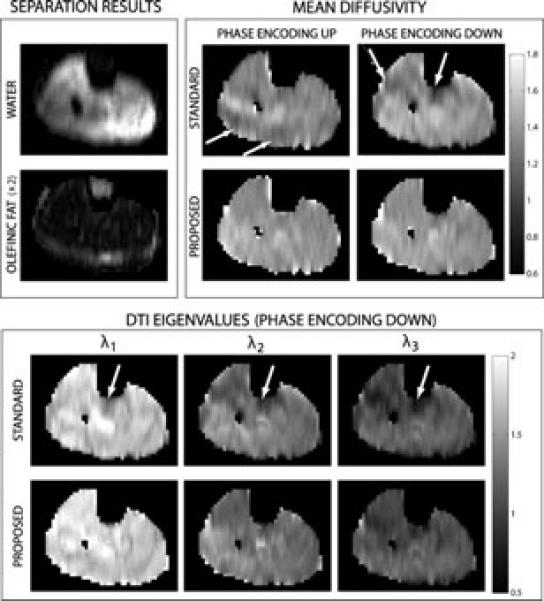
Results from a calf dataset. (Top left) Results from the proposed method for separation of water and olefinic fat from magnitude DW images. (Top right) MD estimates using the standard and proposed methods, and acquired with and without reversal of the EPI phase encoding ordering. Different phase encoding orderings give rise to different directions of the olefinic fat CSA, creating different problematic regions in the MD maps. These regions are largely fixed with the proposed method, for both phase encoding orderings. (Bottom) DTI eigenvalue maps obtained from the standard and the proposed methods.