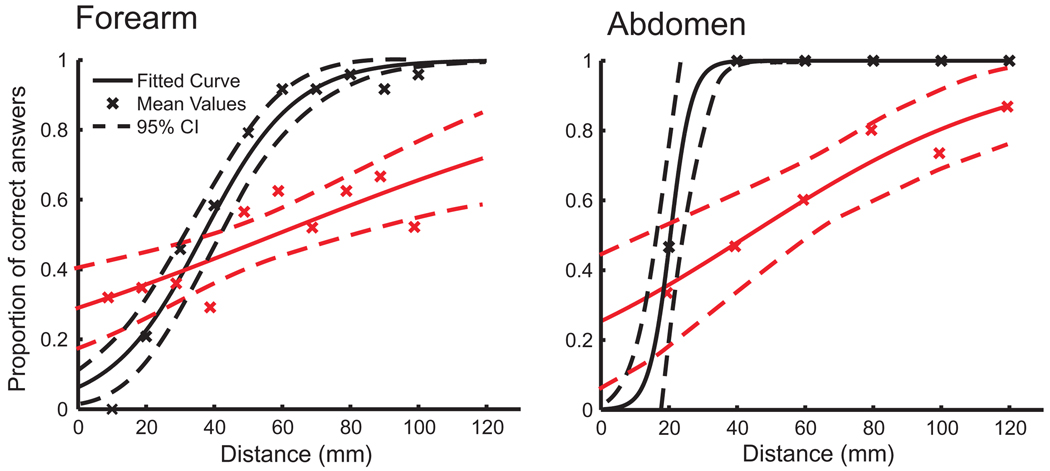
Fig. 2.
Two-point discrimination thresholds. The proportions of correct answers after two points were stimulated by tactile (black) or painful heat (red) stimuli indicated by crosses. The data were fitted to a logistic function (solid line) with the 95% confidence interval (95% CI; dashed line). Please note that differences in the tactile two-point discrimination threshold may be due to different probe sizes.

