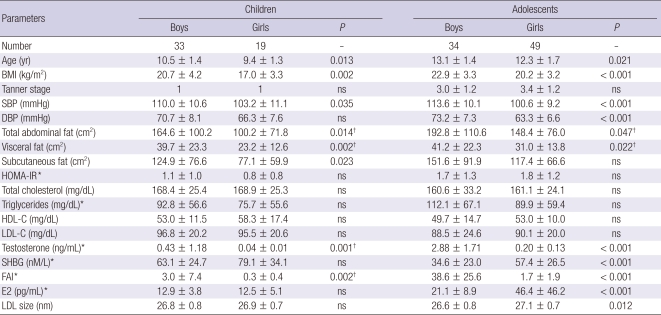
Table 1.
Comparison of clinical and biochemical parameters and LDL particle size by sex in children and adolescents
Data are presented as means ± SD; P values by Student's t-test for continuous variables and χ2 tests for categorical variables are given. *log-transformed; †not significant after adjustment for BMI and age by ANCOVA. BMI, body mass index; HOMA-IR, homeostasis model assessment for insulin resistance; HDL-C, high density lipoprotein cholesterol; LDL-C, low density lipoprotein cholesterol; SBP, systolic blood pressure; DBP, diastolic blood pressure; SHBG, sex hormone-binding globulin; FAI, free androgen index; E2, estradiol; LDL, low density lipoprotein; ns, not significant.

