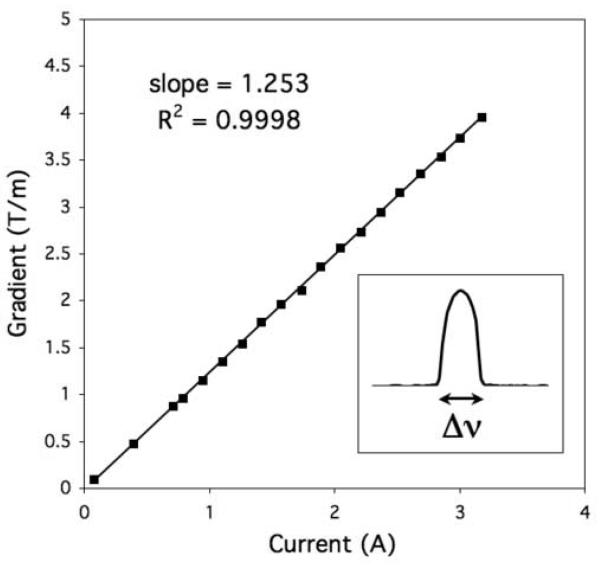
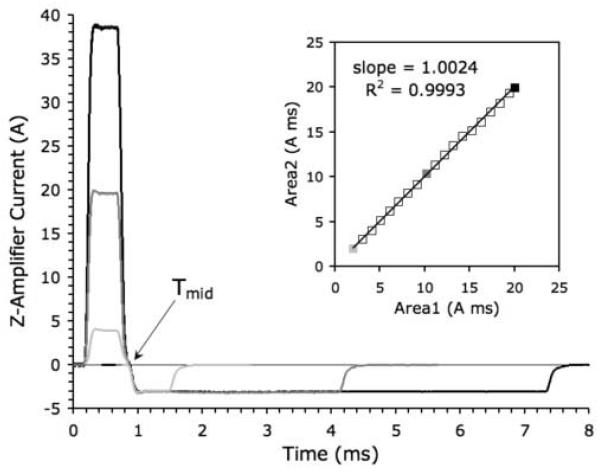
Figure 4.
(a) Measured Micro-Z calibration curve for calibration step A (0-4 T/m). Inset shows a typical z-axis projection of the capillary tube and the measurement of its width Δν. (b) Measured Micro-Z gradient waveforms for calibration step B (4-50 T/m). Here Gz1 ≈ 5, 25, 49 T/m, and Δ = δ1. Inset shows equal pulse areas at each Gz1 after adjusting δ2.


