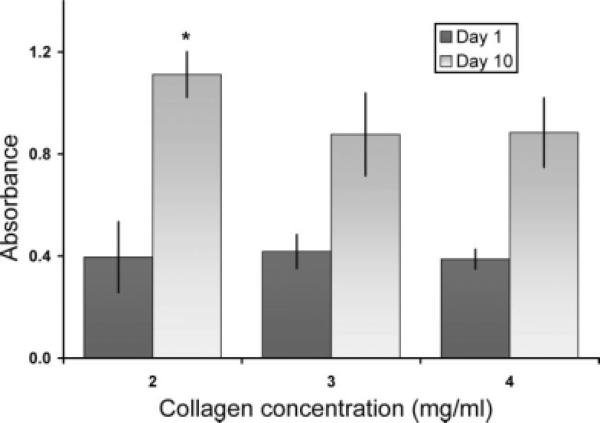
Figure 3.
Fibroblast proliferation over 10 days as a function of collagen concentration, n = 6 per group and per time point (* denotes statistically significant difference with respect to other day-10 groups, p < 0.005). Day 1 absorbancies around 0.4 reflect initial cell density of 5 × 10⁵ cells/mL (i.e., 2.5 × 10⁵ cells per construct). Columns and error bars represent mean and standard deviation, respectively.

