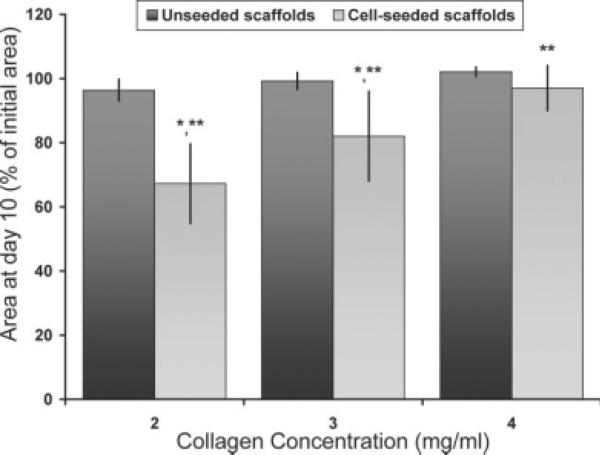
Figure 4.
Retraction of cultured FPC-collagen hydrogels shown as percent decrease with respect to initial area (day 1), n = 6 for cell-seeded groups and n = 3 for unseeded groups. Initial areas of all groups were similar, p = 0.14. * denotes statistically significant difference when comparing cell seeding conditions at day 10 and time (i.e., day 10 vs. days 1 and 7), in both cases, p < 0.001. ** denotes statistically significant difference when comparing cell-seeded groups at day 10, p < 0.001. Columns and error bars represent mean and standard deviation, respectively.

