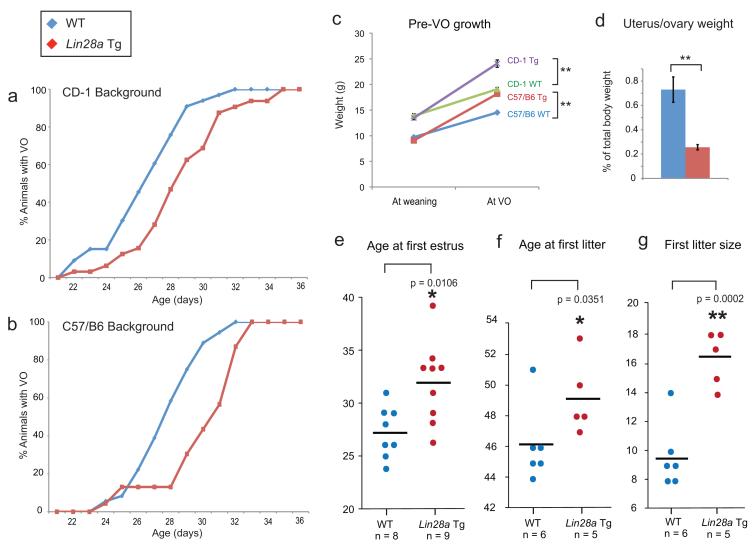
Figure 2. Lin28a Tg mice show a delay in the onset of puberty.
(a-b) Comparison of the timing of vaginal opening (VO) in WT (blue) and transgenic mice (red) on the CD-1 (a) and C57/B6 backgrounds (b). The cumulative percent of animals with VO is displayed. (c) Weights of WT and Lin28a Tg mice at date of weaning and time of VO. (d) Uterus/ovary weights measured as a percentage of total body weight at day 26 of age (n = 10 and 8). (e) The time to first estrus. (f) The time to first litter. (g) The first litter size from these matings. All values represent means +/− SEM (*, p < 0.05; **, p <0.01) and the numbers of mice (n) are shown in the chart or noted in the legend.

