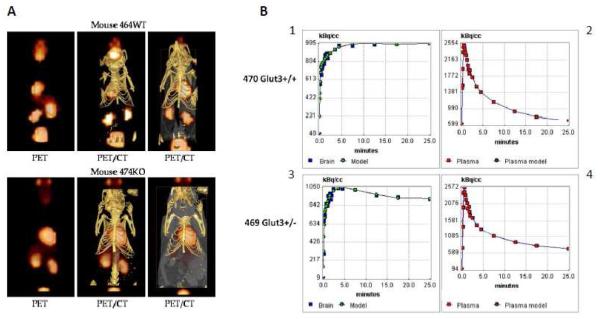
Figure 4. Representative PET/CT images from a Glut3+/− and Glut3+/+ mouse.
Panel A shows examples of PET and PET/CT composite images for a heterozygous mouse (lower images) and a normal littermate. Panel B displays graphs of the time course of brain uptake and blood disappearance of 18F-FDG for a Glut3+/+ mouse and a Glut3+/− mouse. Graphs 1 and 3 also include points generated using the two-compartment model generated by the kinetic analysis. The kinetic data were indistinguishable between mice with the two Glut3 genotypes.

