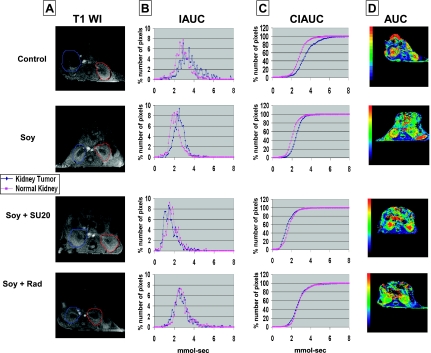
Figure 6.
DCE-MRI imaging of vascular changes induced by soy combined with sunitinib or radiation in KCI-18 kidney tumors. In separate experiments, mice bearing established kidney tumors were treated with soy, soy + SU20, or soy + Rad using the schedule and doses described in Figure 5. Mice were imaged by DCE-MRI on day 17. (A) T1-weighted images (T1 WI): Baseline images before Gd contrast agent injection as described in Figure 5. (B) IAUC graphs: Data from the C(t) curves were compiled for nine time points after Gd injection to draw IAUC63. (C) CIAUC graphs: CIAUC curves were derived from IAUC curves. In A, B, and C panels, blue lines are for kidney tumors and pink lines are for normal kidneys. (D) AUC parametric map: Parametric color maps were constructed as described in Figure 5. The tumor-bearing kidney is on the left and the normal contralateral kidney is on the right of the MR images. The color coding in the kidneys is shown for integrated AUC. Data from a representative mouse from each treatment group are presented.

