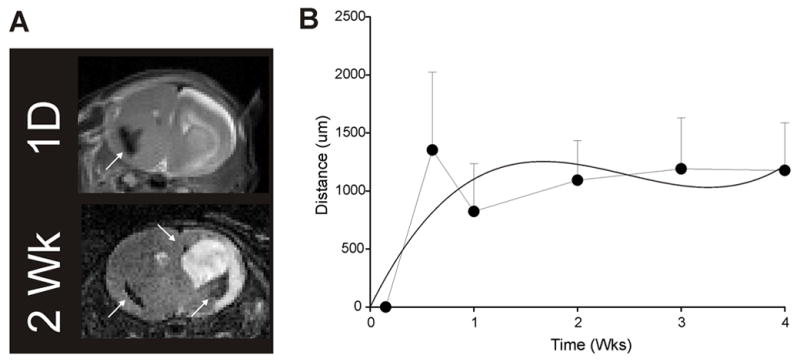
Figure 3.

NSC migration rates. Migration rates were determined by measuring the leading edge of NSCs as they migrated through tissue. NSCs migrate rapidly at about 100 microns per day for the first few days after implantation and presumably are extralesional. Migration then plateaus when NSCs are presumably intralesional. Curves were generated using a Euclidean function. The data were curve fitted to estimate overall migrational distances (solid curved line).
