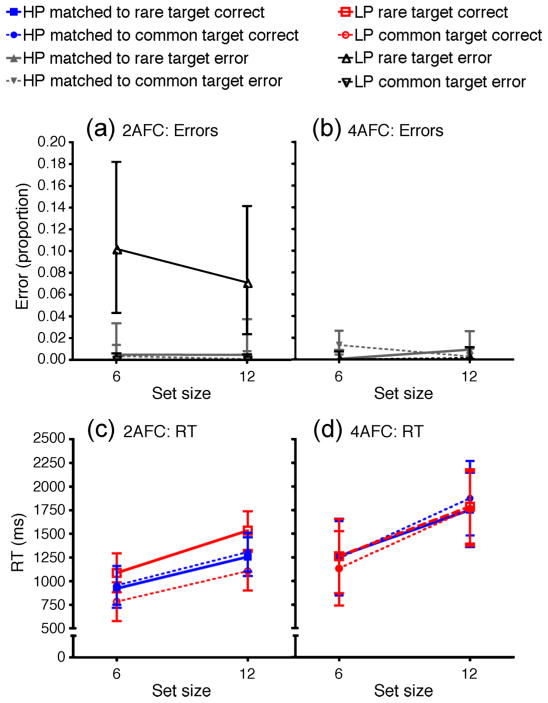
Figure 10.
Results from Experiment 4 where participants identified the orientation of the target T. (a) 2AFC mean error rate (proportion), (b) 4AFC mean error rate (proportion), (c) 2AFC mean RT (ms), and (d) 4AFC mean RT (ms), for correct and incorrect responses for each of the prevalence and target frequency conditions, plotted by set size. Error bars represent within-subjects 95% confidence intervals. AFC = alternative forced-choice. HP = high prevalence, LP = low prevalence.

