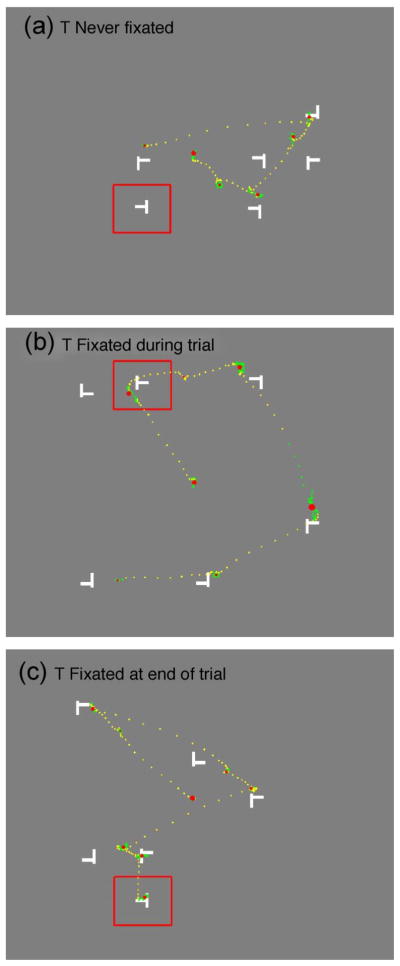
Figure 4.
Example scan paths from low prevalence miss trials classified into trials where (a) the target was never fixated, (b) the target was fixated during the trial, and (c) the target was fixated at the end of the trial. Red dots indicate fixations, green dots identify data points that were indicative of the fixation and yellow dots trace the saccade. The red box denotes the region defined as ‘landing on the target’.

