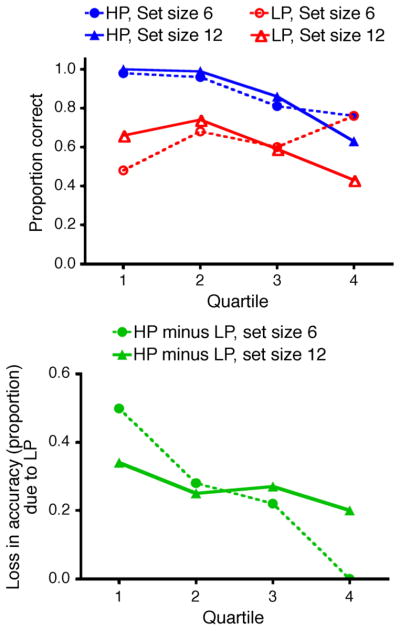
Figure 5.
(a) Proportion of correct target-present trials as a function of RT quartile. (b) Difference in proportion correct target-present trials between high and low prevalence. Positive values indicate increased miss error rate at low prevalence. HP = high (50%) prevalence, LP = low (2%) prevalence.

