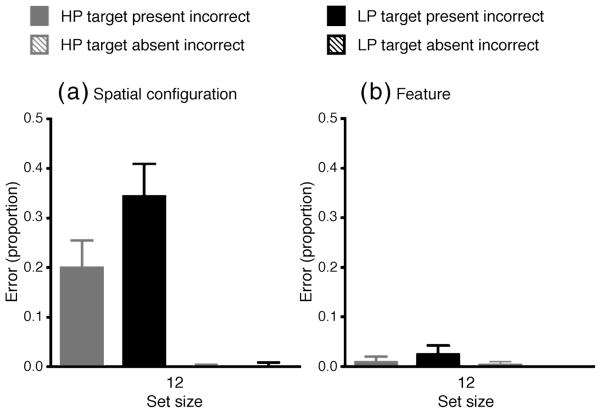
Figure 9.
Mean error rates (proportion) from Experiment 3 where participants were forced to wait a set duration before responding for (a) the spatial configuration search; and (b) the feature search. Error bars represent within-subjects 95% confidence intervals. HP = high (50%) prevalence, LP = low (2%) prevalence.

