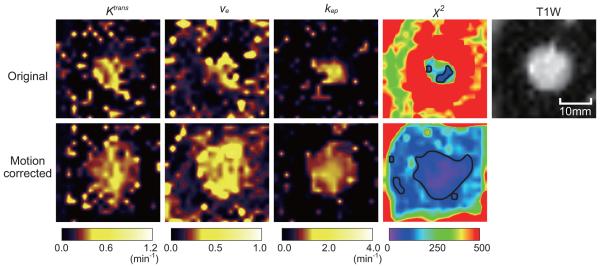
Figure 2.
Representative maps of Ktrans, ve and kep generated from the original and motion-corrected DCE-MRI from one patient. The χ2 maps and T1-weighted image are also shown. The contours of the reliable pixel areas are indicated by the black line on the χ2 maps. The χ2 map generated from the motion-corrected DCE-MRI shows a broadened acceptable pixel area covering the greater area of the SPN, when compared to the map from the original DCE-MRI. The Ktrans, ve and kep maps from the motion-corrected DCE-MRI show better reflections of the boundary of the nodule than those from the original DCE-MRI.

