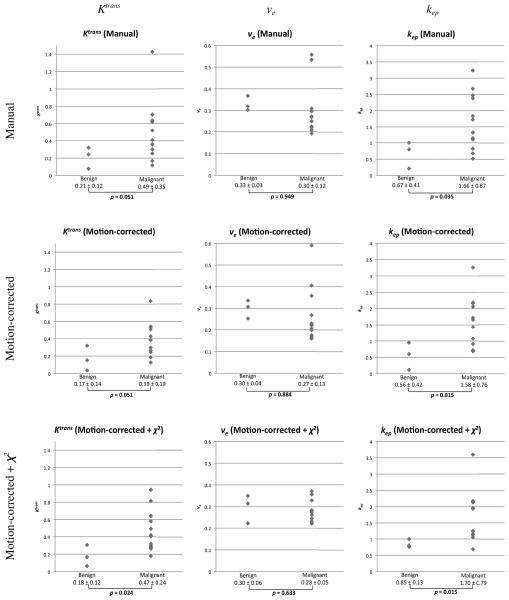
Figure 3.
The distributions of Ktrans, ve, and kep derived from the manually-measured curves (Manual) and mean Ktrans, ve and kep in the reliable pixels in the parameter maps estimated from the motion-corrected DCE-MRI without χ2 test (Motion-corrected) and with χ2 test (Motion-corrected + χ2) are plotted for benign (n=3) and malignant (n=12). P-values derived from two-sample Mann-Whitney U test between benign and malignant are presented below each plots.

