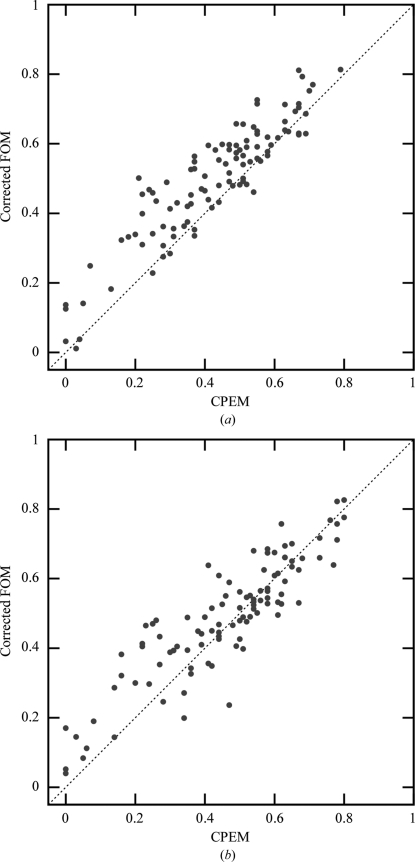
Figure 3.
Average figure of merit corrected for bias after phasing versus cosine of the mean phase error (CPEM) for each data set after 20 cycles of β-corrected density modification by (a) Parrot and (b) SOLOMON. The phasing bias-corrected figure of merit is defined as m corr = m − [m ph − cos(δϕph)], where m is the figure of merit after density modification, m ph is the figure of merit after experimental phasing and δϕph is the phase error after phasing.

