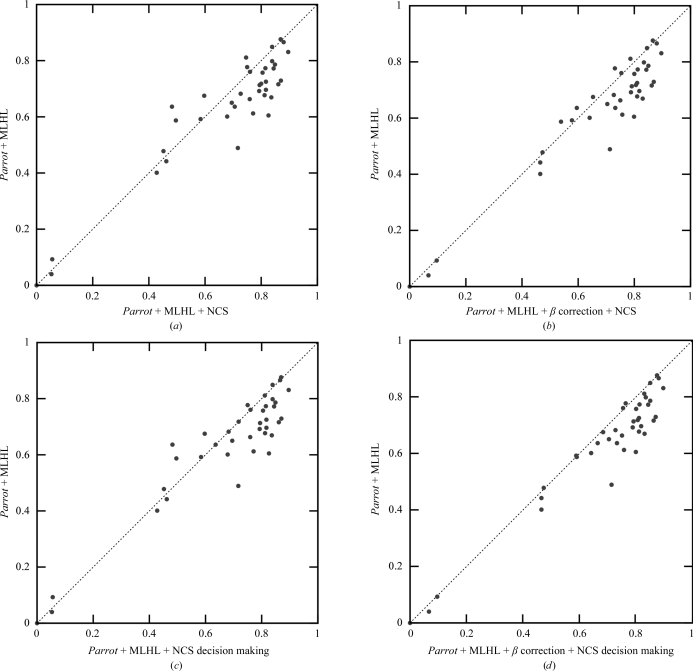
Figure 7.
Correlation of a map constructed from a deposited model with the map after Parrot density modification without NCS averaging and without β correction (y axis) plotted against the map correlation after Parrot using NCS averaging (x axis) (a) without β correction, (b) with β correction, (c) with figure-of-merit-based decision-making and without β correction and (d) with figure-of-merit-based decision making and with β correction. Only the data sets for which Parrot determined NCS operators from the heavy-atom substructure are shown. Solvent flattening and histogram matching were used in all tests.

