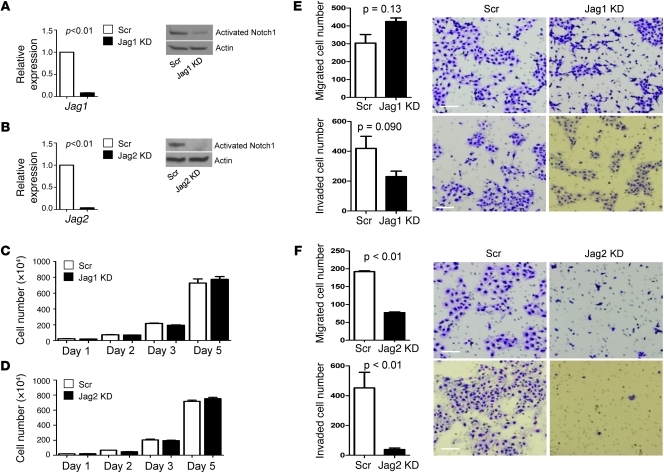
Figure 3. Characterization of Jagged-depleted 344SQ cells.
(A and B) Jagged depletion inactivates Notch. Quantification of (A) Jag1 and (B) Jag2 mRNA by quantitative PCR (bar graph) and Notch activation by Western blotting of cleaved Notch1 (gels) in Jagged1-depleted (Jag1 KD), Jagged2-depleted (Jag2 KD), and control (Scr) 344SQ transfectants. Quantitative PCR values were normalized based on L32 mRNA and expressed as the mean values of replicate (triplicate) samples relative to that of controls, which were set at 1.0. Actin indicates relative protein loading. (C and D) Jagged depletion has no effect on 344SQ cell proliferation. Quantification of (C) Jagged1-depleted and (D) Jagged2-depleted 344SQ cells grown in monolayer, counted at the indicated time points and expressed as the mean values (± SD) of replicate (triplicate) wells. (E and F) Inhibition of 344SQ cell migration and invasion by depletion of Jagged2 but not Jagged1. Images of migrated (top rows) and invaded (bottom rows) (E) Jagged1-depleted, (F) Jagged2-depleted, and (E and F) control 344SQ cells, which were counted and expressed as the mean values (± SD) of replicate (triplicate) wells (bar graphs), with P values from Welch’s t test using log-transformed data. Scale bars: 100 μm.

